A curated collection of research reports, articles, and more – your source for valuable project insights.

Ethiopia’s mobile money ecosystem is expanding, but adoption remains uneven. While most adults now own mobile phones and...
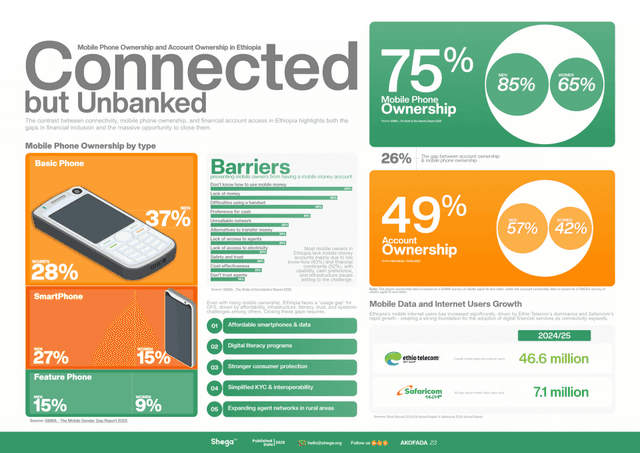
Ethiopia is experiencing one of the fastest digital connectivity surges in Africa — mobile internet users grew significa...

Behind Ethiopia’s informal economy are millions of workers navigating daily financial decisions, and access to finance, ...

Ethiopia now boasts over 540,000 reported agents, processing ETB 889 billion in transaction value and 125 million transa...
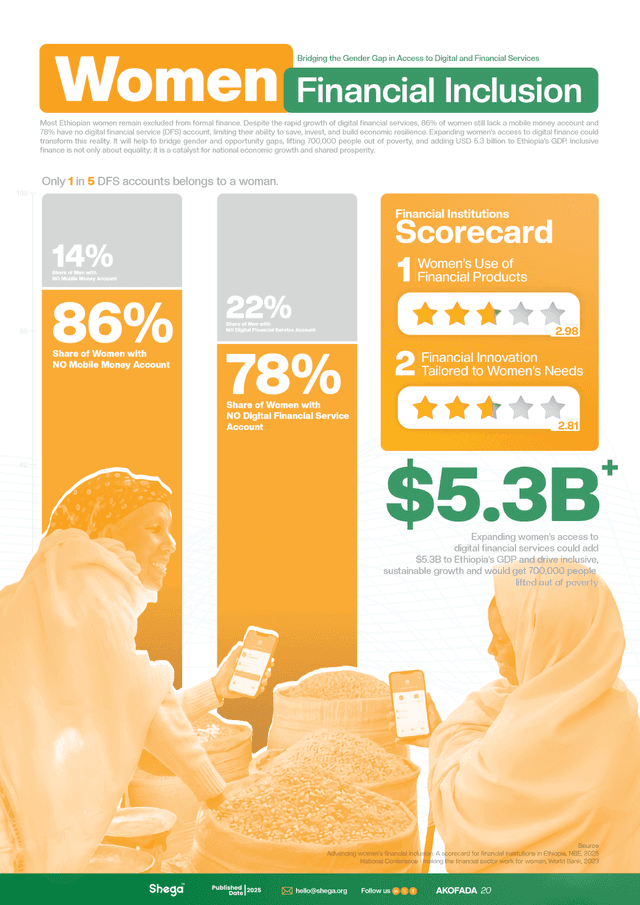
This infographic explores the persistent gender gap in Ethiopia’s financial inclusion landscape. Despite progress in dig...
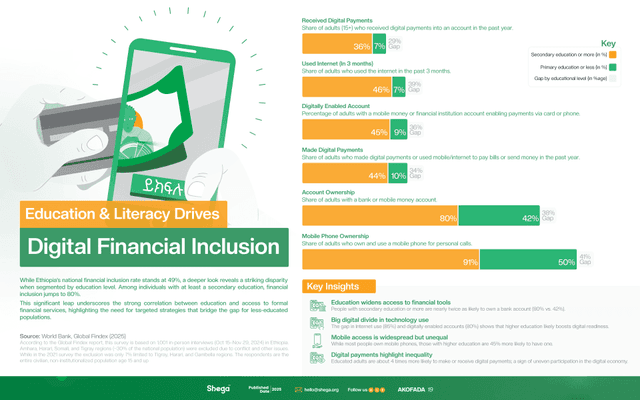
This infographic highlights how education and literacy drive digital financial inclusion in Ethiopia. It shows that adul...
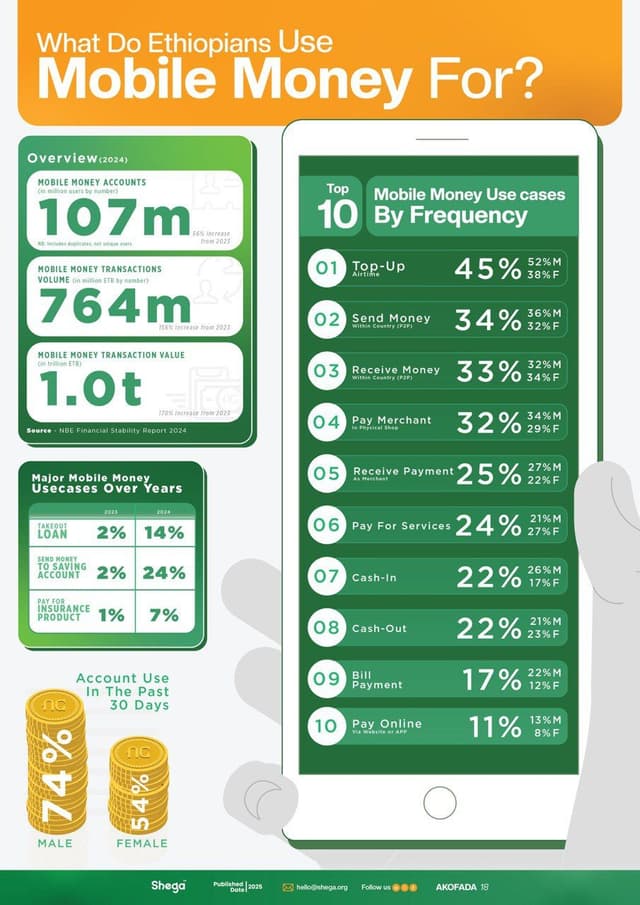
This infographic highlights how Ethiopians use mobile money, showing that the country has over 107 million registered mo...

This infographic, based on Global Findex 2025 data, illustrates Ethiopia’s progress in advancing financial inclusion. Ac...
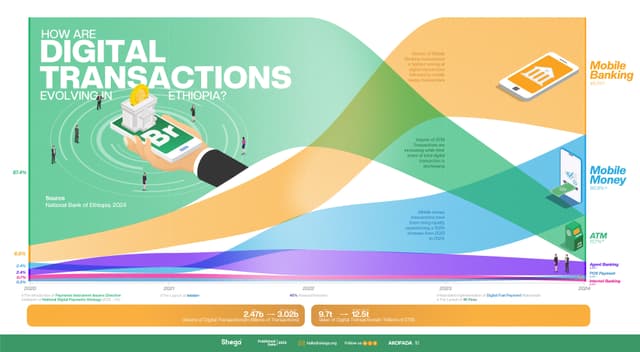
Ethiopia is rapidly expanding digital financial transactions. Mobile banking is the most popular method, followed by mob...

This infographic highlights the state of digital financial service (DFS) awareness in Ethiopia and the main factors affe...

This infographic presents an overview of non-bank financial institutions operating in Ethiopia as of April 2025, emphasi...
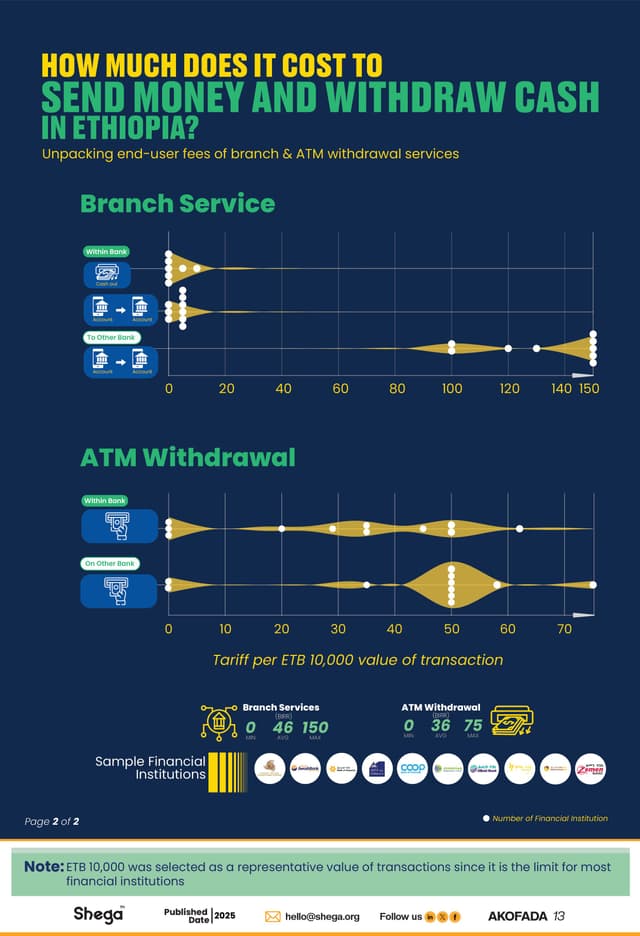
This infographic provides a comparison of the fees for sending money and withdrawing cash in Ethiopia using branch and A...